


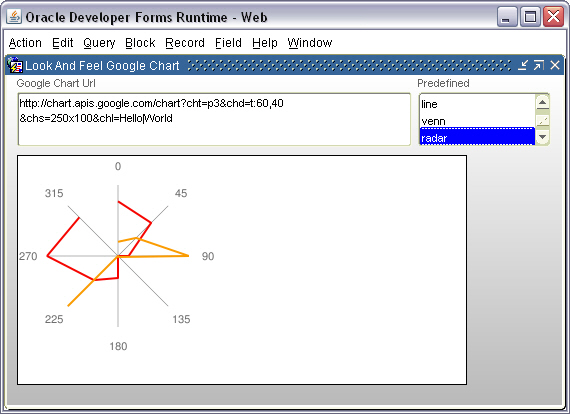
One of the features of the Look and Feel Project, is the capability to add items at runtime, and more particularly Image items, via the IMG_NEW method. As Google Charts are PNG images, it is easy to use a dynamic image to display them.
Only 3 instructions are required:
Declare
LC$Chart Varchar2(2000) := 'http://chart.apis.google.com/chart?cht=v&chs=200x100&chd=t:100,80,60,30,25,20,10';
Begin
-- add image to the canvas --
Set_Custom_Property('LAF_BLOCK.LAF_BEAN',1,'IMG_NEW','img,10,80,450,230');
Set_Custom_Property('LAF_BLOCK.LAF_BEAN',1,'IMG_SET_BORDER','img,line' ) ;
-- populate image --
Set_Custom_Property('LAF_BLOCK.LAF_BEAN',1,'IMG_READIMGFILE'
,'img,' || replace(LC$Chart,',','%2C'));
End;
That's all !
I have added a new test_laf_gchart.fmb sample dialog in the current LAF_1772.zip if you want to play with.
Francois


